The Loop
Is distance really out of control?
While the golf intelligentsia continue to debate the merits or demerits of using an anchored putter and whether golf's ruling bodies will eventually announce a ban (all the tea leaves say yes, effective with the next rules revision in 2016), it's an under-reported event that bubbled up out of the last few weeks' results that may spur even more heated debate.
It's driving distance, only this time the numbers seem to be showing a curious movement away from, not toward, cataclysm, despite where we saw tee shots flying during last week's event in Ohio.
After an admittedly soft and less bouncy Open Championship (the driving distance average for the week was about 18 yards shorter than it was in 2011) and a somewhat soft RBC Canadian Open, we saw the most explosive long driving week on tour ever at the WGC-Bridgestone Invitational. The field average for the week was 313.8 yards, second longest ever, trailing only last year's Reno Tahoe Open, played at elevation (314.7). Bubba Watson led the field by averaging nearly 350 yards off the tee, but he was only one of 23 players who averaged 320 or better for the week. It should not be overlooked that Ohio is in a drought, the temperatures were high and the fairways were runways and most of the biggest hits were downhill. __
__Those numbers seem fitting, even required, as the world's best players get ready to take on The Ocean Course at Kiawah Island Resort in this week's PGA Championship. Though tees can be altered every day, the course could play 7,676 yards, making it the longest site for a major championship ever, or 350 yards longer than when it was the site of the 1991 Ryder Cup. But is the rush toward 7,500-yard major championship sites just an eventual stepping stone to 8,000-yard sites? (The Ocean Course already has tees that can stretch to nearly that length, if necessary.)
Deep breaths...
While average driving distance on the PGA Tour is now 288.8 yards, that's still 1.8 yards behind the pace for 2011, which set an all-time high average of 290.9. Of course, it's also ahead of the pace of every other year since the PGA Tour started recording stats.
The U.S. Golf Association and Royal & Ancient Golf Club of St. Andrews have been studying distance intensely for the last decade, on the heels of their release of the Joint Statement of Principles in 2002. That document warned of future golf ball distance gains as being "undesirable."

The question in many minds thus has become, "Are we at a level now that is "undesirable"? But maybe the question is based on a flawed assumption. Are driving distance statistics across all tours, numbers which are readily available for public review, showing a mad rush toward catastrophically "undesirable" numbers?
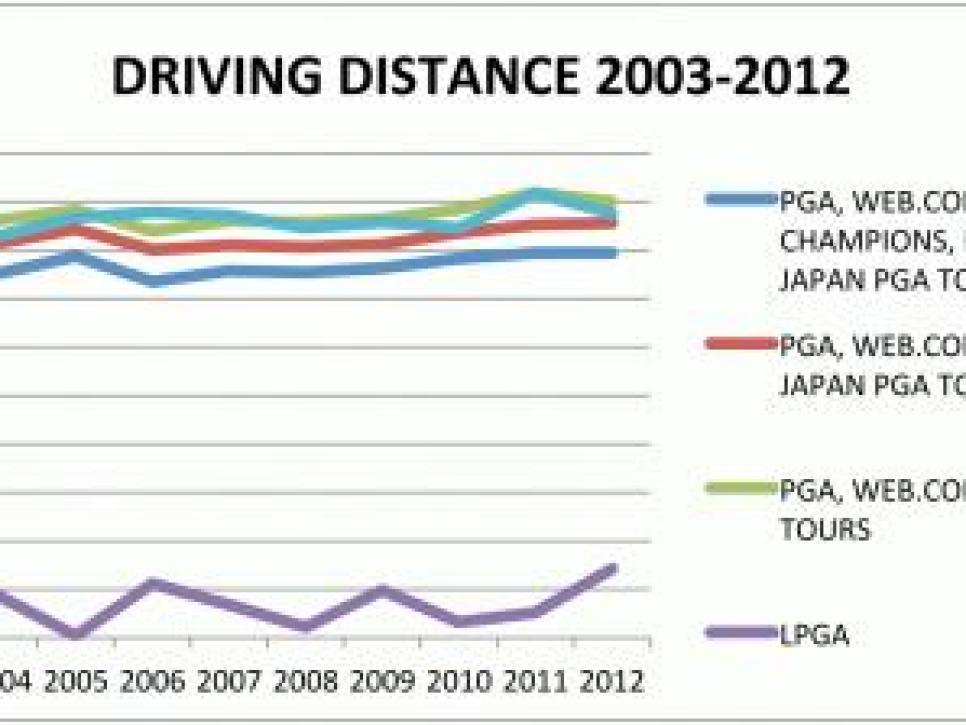
In fact, the numbers aren't entirely convincing. Generally, quite the opposite, in fact. Now, we have to work on the assumption that driving distance numbers reported from the tours are reliable, that they are as valid an indication of the distance tour players hit the ball in competition as they have always been. To date, and in my research, there is no evidence of a conspiracy to suppress or under-report driving distance. And there is no indication of an overwhelming trend of 3-woods replacing drivers on holes where driving distance is measured. So let's move on from there. If you take a look at the average driving distance on all male professional tours for which data is available (PGA Tour, Web.com Tour, European Tour, Japan PGA Tour and Champions Tour) in the decade since the Joint Statement was released (2003-2012), the overall average has moved minimally: Two yards during that time (282.7 to 284.7).

Since the Champions Tour is not really an indication of elite distance potential, let's eliminate its effect on our numbers. In that case the average of all other tours driving distance has only increased 1.9 yards in the last decade (285.9 to 287.8, or about the length of a really fancy scorecard per year).
We could also make the argument that the Japan PGA Tour is not known for long hitters (only 12 players on the JPGA Tour have averaged over 300 yards in the last decade, while there are currently 21 on the PGA Tour this year alone). So let's remove them from our average. Just looking then at the PGA Tour, Web.com Tour and European Tour combined driving distance average, the increase from 2003 to 2012 is 1.8 yards, or about the length of that hot dog at the turn after your first bite.
We can also look at the LPGA to see whether the distance trend is having an effect there. The LPGA numbers over the last decade appear to not move in any particular direction (up two yards one year, down four yards the next, etc.). But comparing the 2003 number with the current figure, driving distance on the LPGA has show improvement of a sort, increasing 2.9 yards. The current figure of 252.1 yards is an all-time high and shows a 4.5 yard increase over last year's year-end number. (One caveat, however: This year's LPGA number is based on only 16 events.)
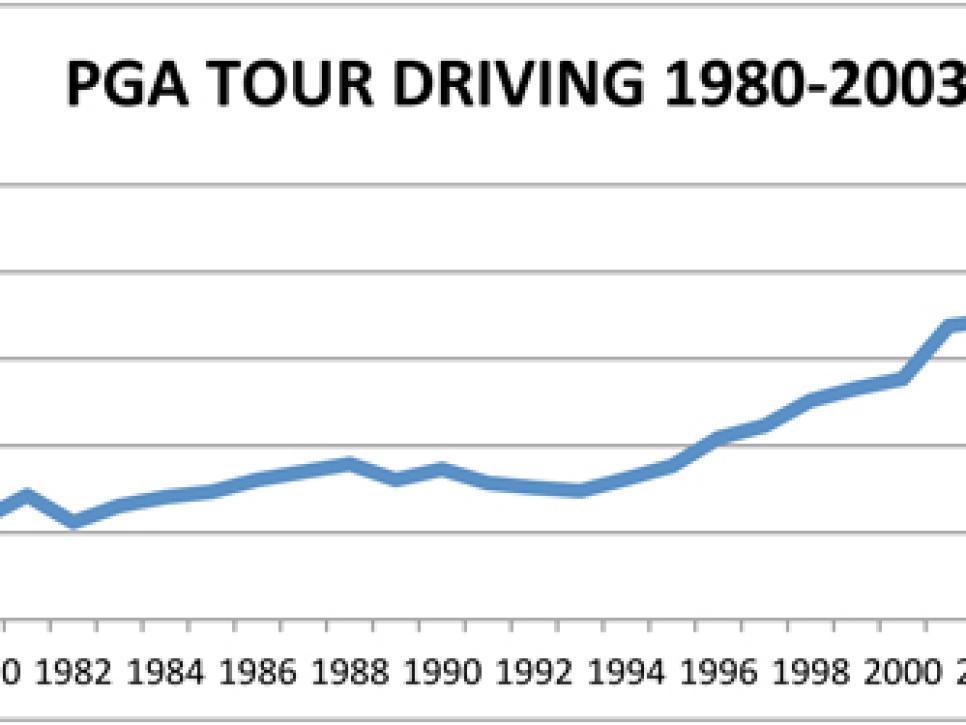
The rate of increase in driving distance on the PGA Tour over the last decade is the lowest for any 10-year period dating back to 1995. Since 1998, distance per decade has been on a yard a year pace, sometimes double that. Now, it appears to be down to less than a foot a year. Even when you consider the PGA Tour all by itself, if the current number stays relatively the same, driving distance over the last decade is up less than three yards. (A year ago at this moment, the PGA Tour driving distance average was 290.6. It finished the year at 290.9. It would be most unusual for the current driving distance number of 288.8 to move more than a yard in either direction the rest of the year.) What was the driving distance rate of increase in the decade that led up to the Joint Statement of Principles? Nearly 20 yards.
You can stare at numbers all day long, of course. Like the PGA Tour's Longest Drives stat. Here's a number that clearly reflects what's happening with the driver, and it would seem to be the case that if distance was reaching a new rate of acceleration, the number required to be ranked in the top 1,000 longest drives of the year would be going way up, too. Well, to make it in the top 1,000 longest drives in 2003 required a poke of 348 yards. This year, that number was 355, an increase, yes, but the number has been as high as 358 (in 2006) and as low as 351 (in 2010), so it's hard to say something incredible is happening all of a sudden. There have been 66 drives of 400 yards or more this year (all but one of those came at either Kapalua or Firestone). High, but not yet an all-time high. There were 83 in 2004. A mixed message, at best.
While many have suggested the game's rulemakers don't have a handle on reigning in technology, specifically distance technology in clubs and balls, is the argument about real numbers? In other words, which is more relevant to the debate, a 313.8-yard driving distance average at one event or a decade of driving statistics from six professional tours? 450 yards is a powerful number, even if it is downhill, downwind in high heat. That's how far Gary Woodland hit a ball at Firestone last week. Scary to some, perhaps. But for perspective, it is 23 yards shorter than Jeff Sluman's tee shot at the Bob Hope Chrysler Classic. When was that? January, 2003.